
A fool's game: An attempt to predict the Championship relegation race
A fool's game: An attempt to predict the Championship relegation race
No fancy AI or machine learning here, just my trusty spreadsheet and some simple maths. And historical precedent in general - and very specifically to Wednesday.

There are fancy prediction models out there, including Opta’s that gives Wednesday a 35% probability of finishing above the bottom three.1
We want to factor in that the recent form of teams is more relevant to a prediction of their remaining games than their season-long form. I’ve, somewhat arbitrarely, set ‘form’ as the last five matches.
We also want to factor in the venue of the game as we know home teams win more often than away teams.2
And, finally, we want to factor in the quality of chances teams produce and concede (Expected Goals) rather than just the goals scored and conceded and the points won.
For goals and Expected Goals we focus on the difference between scored/produced and conceded whereas for points it’s a simple points per game.
These three figures - xG difference, goal difference, points per game - are then simply added together for a team’s last five matches seperately for home and away matches.
And, finally, I turn those home and away figures into a scale of 0 (easiest) to 1 (hardest).
We can then create both a home ‘rating’ and an away ‘rating’ from 0 to 1 for each of the Championship’s 24 teams, ranked by their current league position:
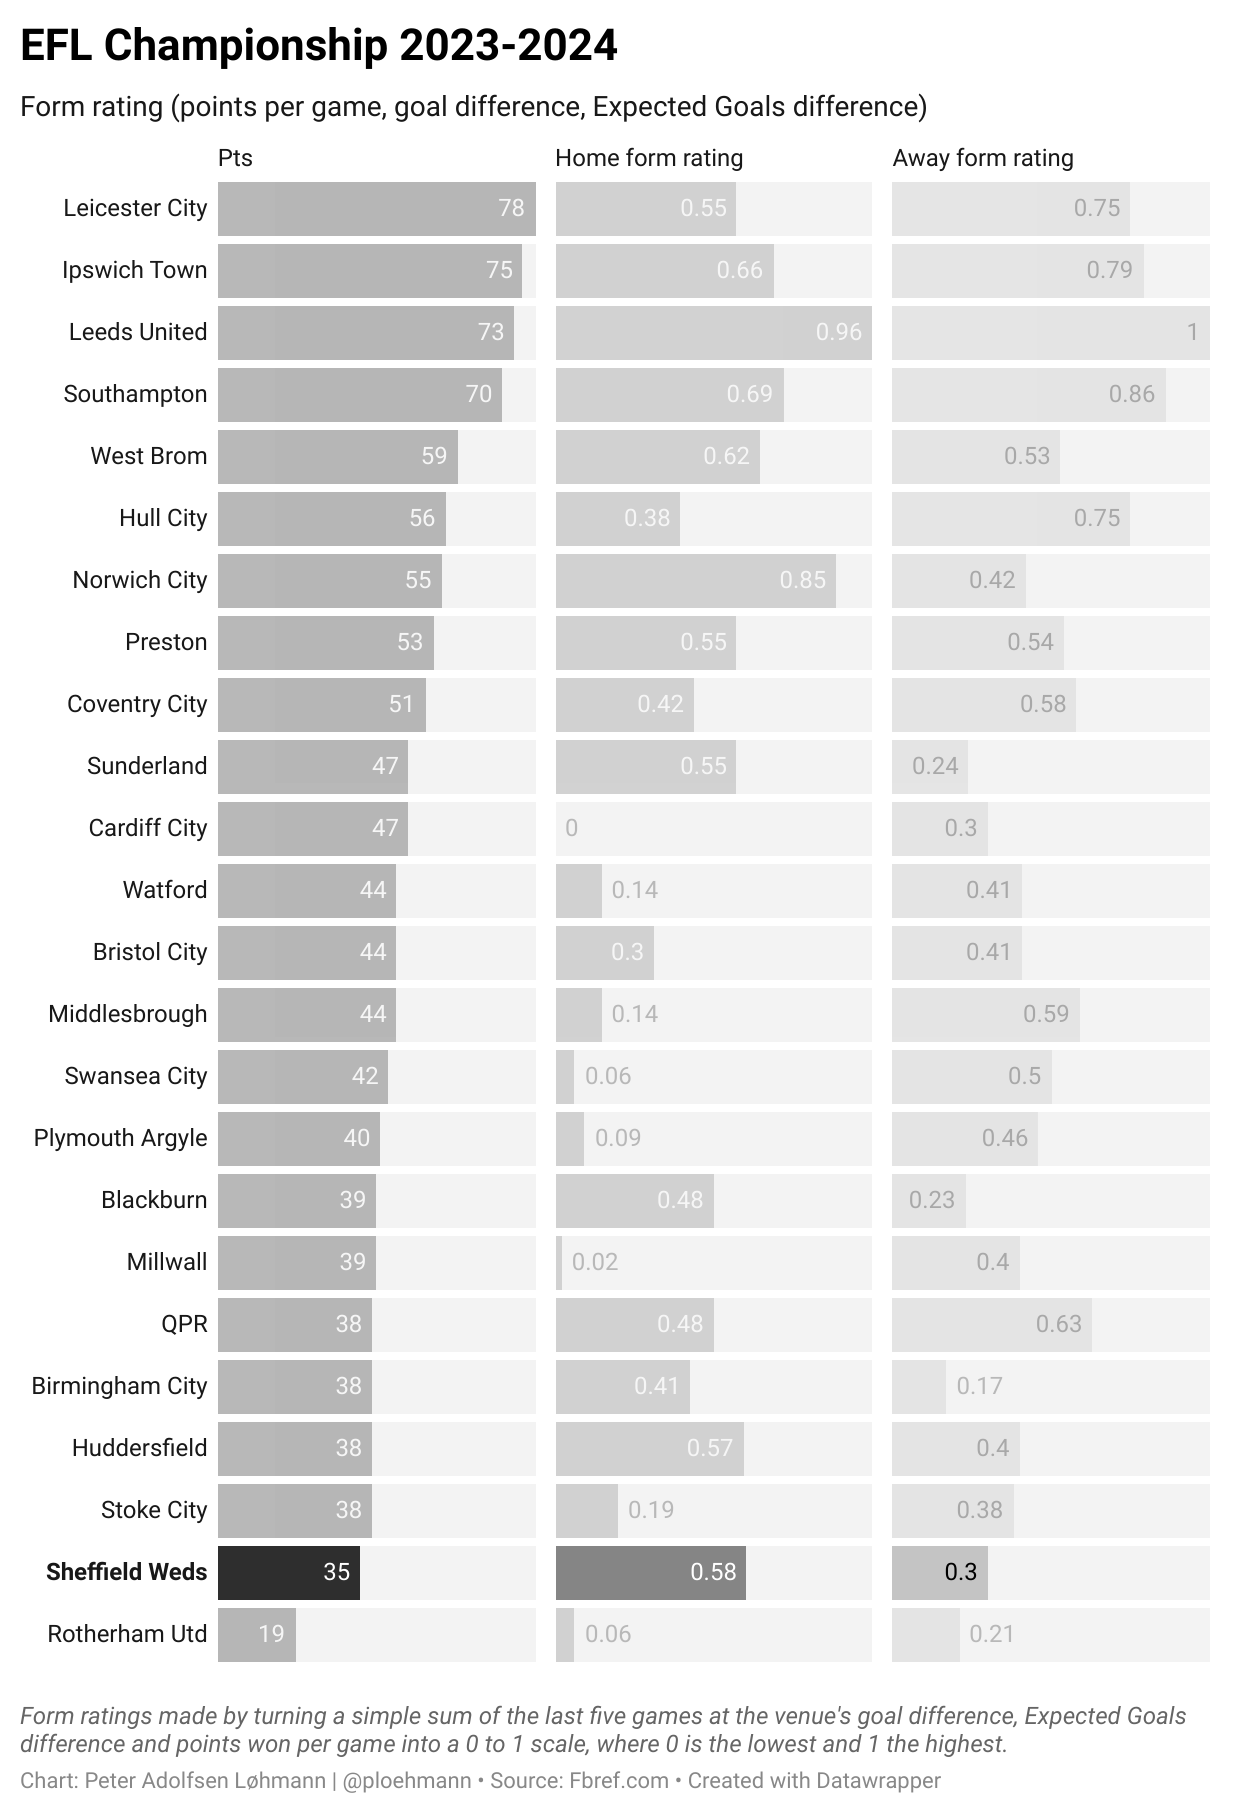
With this simple measure we can see Wednesday’s home form rating is that of a team in the Play-Offs (6th), whereas the away form rating is the fifth worst in the division. We can also see the recent flurry of form among teams immediately above us - and the poor recent form, especially at home, of those around midtable.
We can use that form rating home and away for every team’s fixture list to get a sense of how hard or easy their remaining fixtures are relative to other teams’:
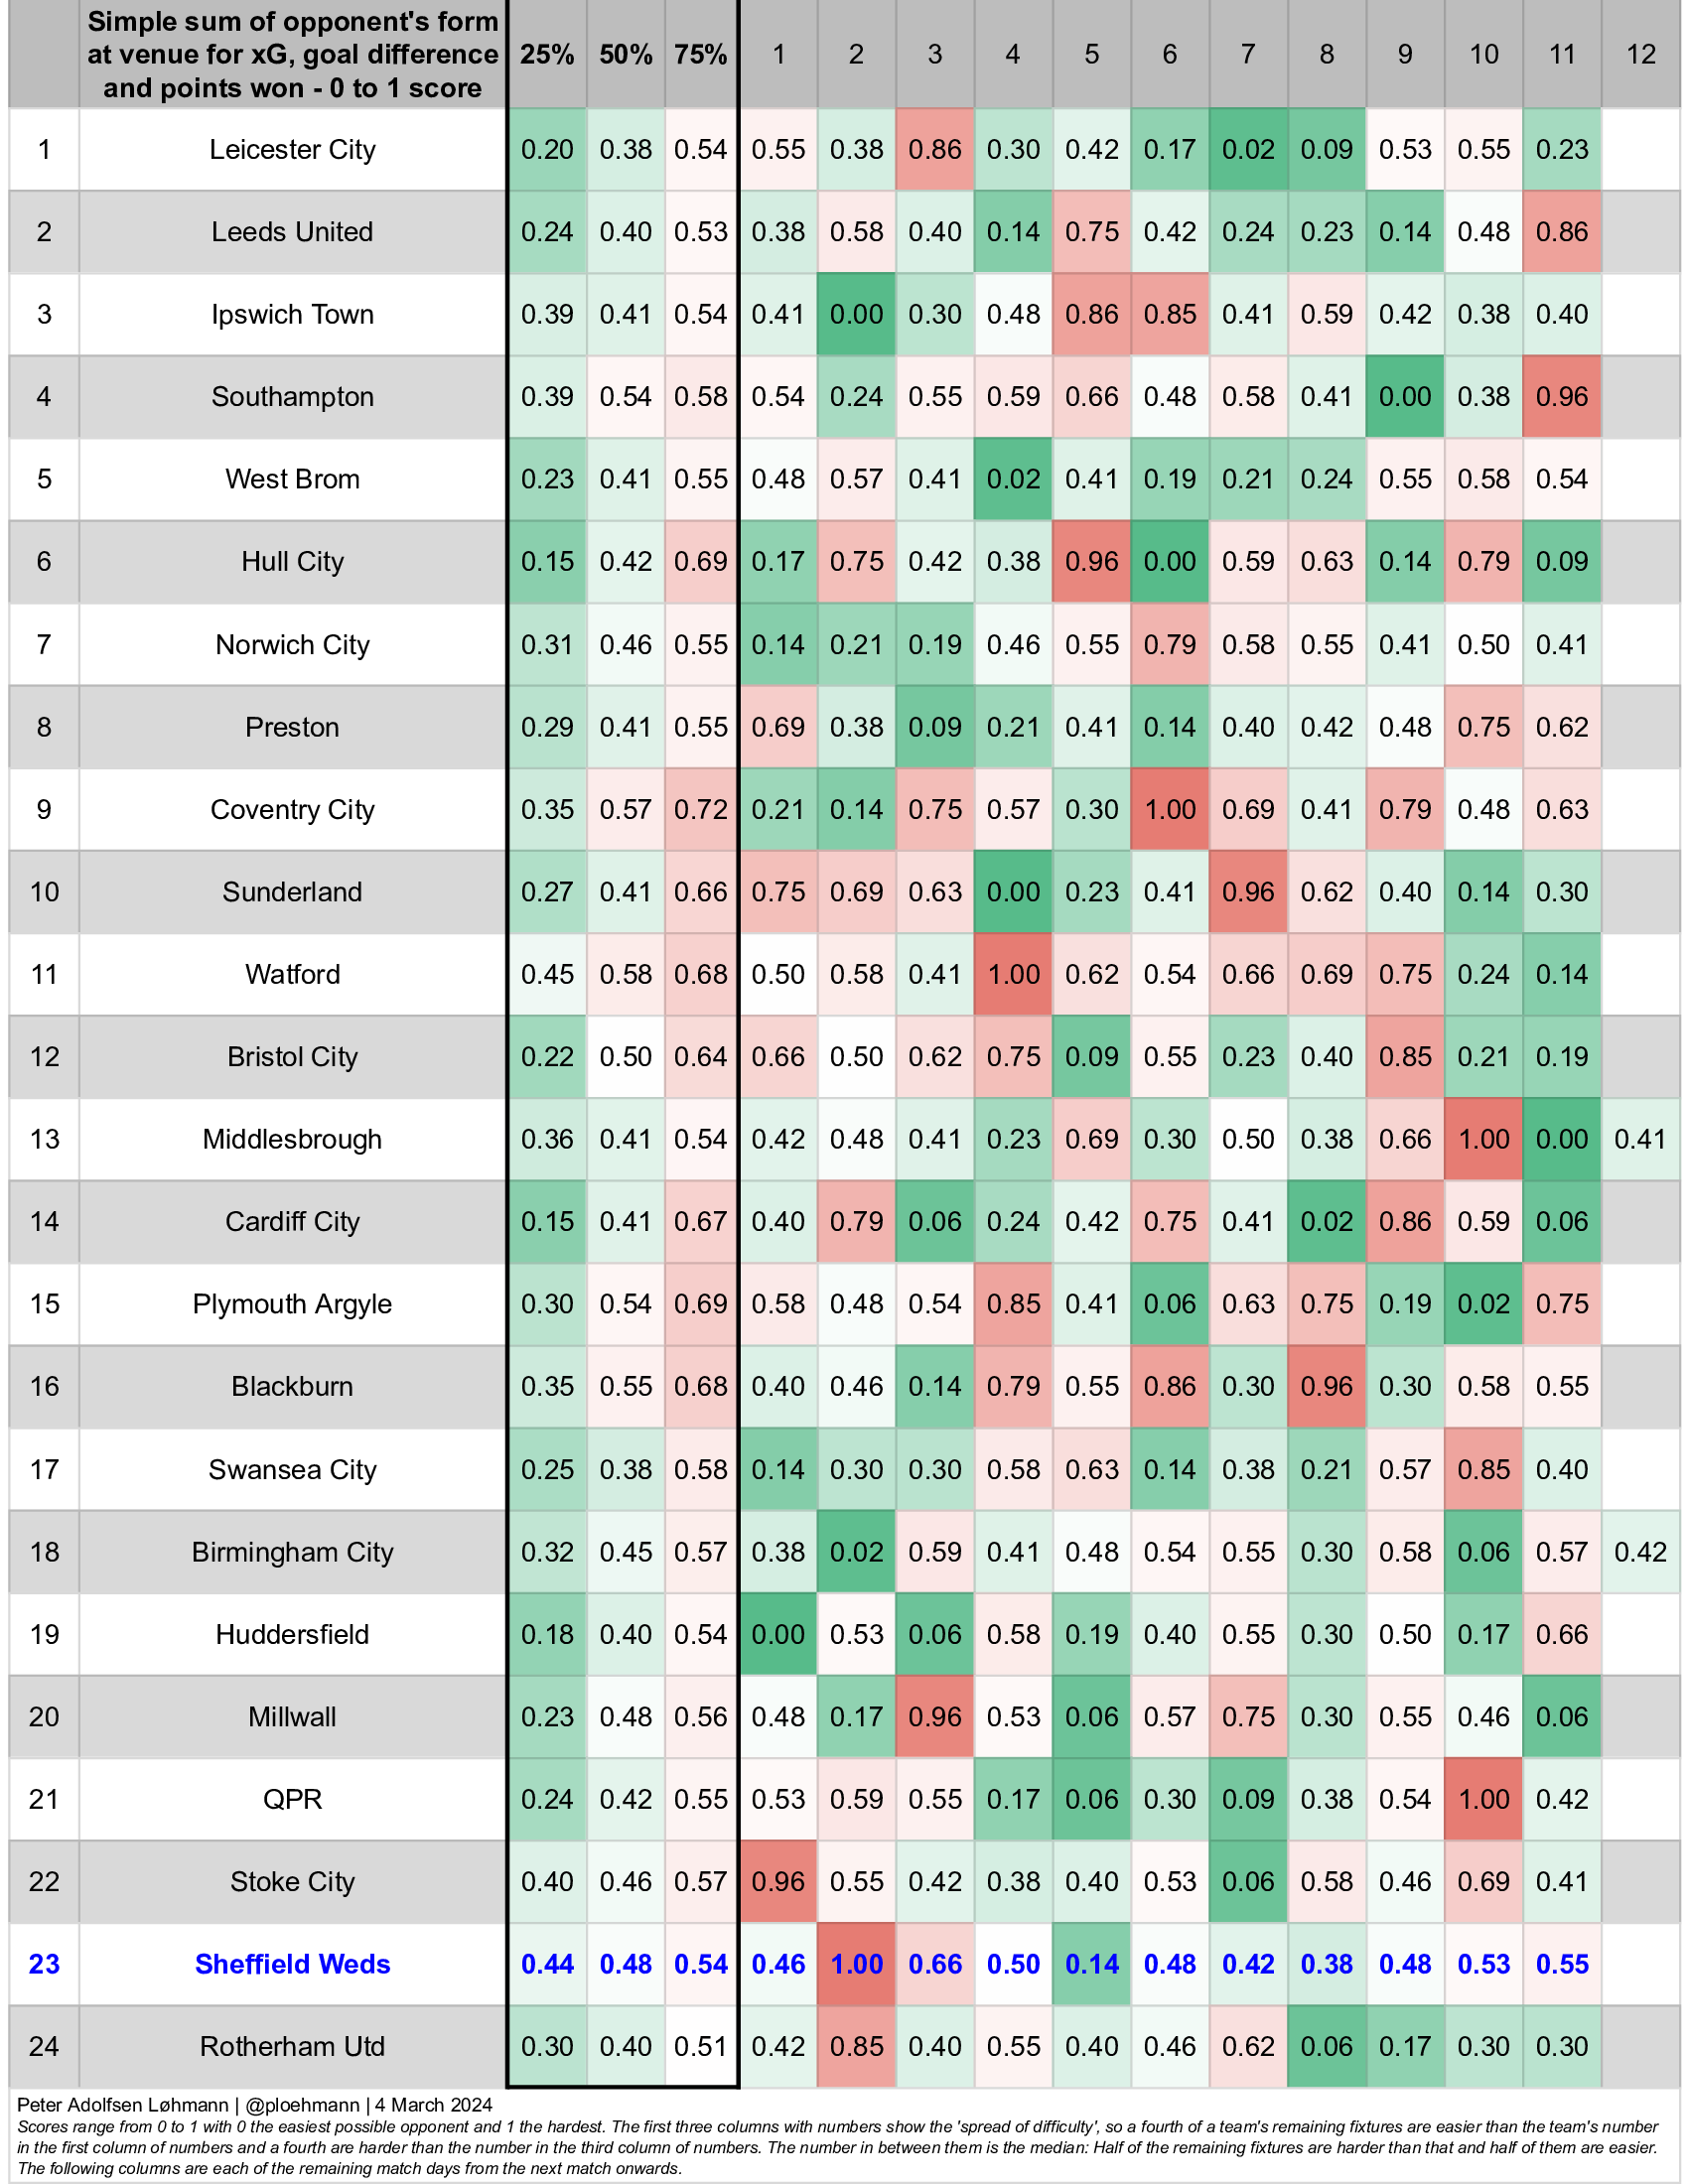
Wednesday don’t face many poor form teams from here on in, but on the other hand the general strength of fixtures - the median - is about the same as every team from 23rd up to 17th.
Now, the form of the teams you’re playing is obviously a factor in how well you can expect to do against them. But so is your own form.
Using the form rating for each opponent in the fixture list and the team’s own form rating (home and away) it’s possible to calculate a simple and (very) rough probability rating of how each remaining game will finish.
When I say simple, that’s what it is: Subtracting the opponent’s form rating for the venue from the team’s own form rating for the venue and the result ranging from 0 points (for the result, when substracting the team’s form rating from the opponents, of -1.0) to 3 points (for the result +1.0) and two teams with the same team ratings both getting 1.5 points.
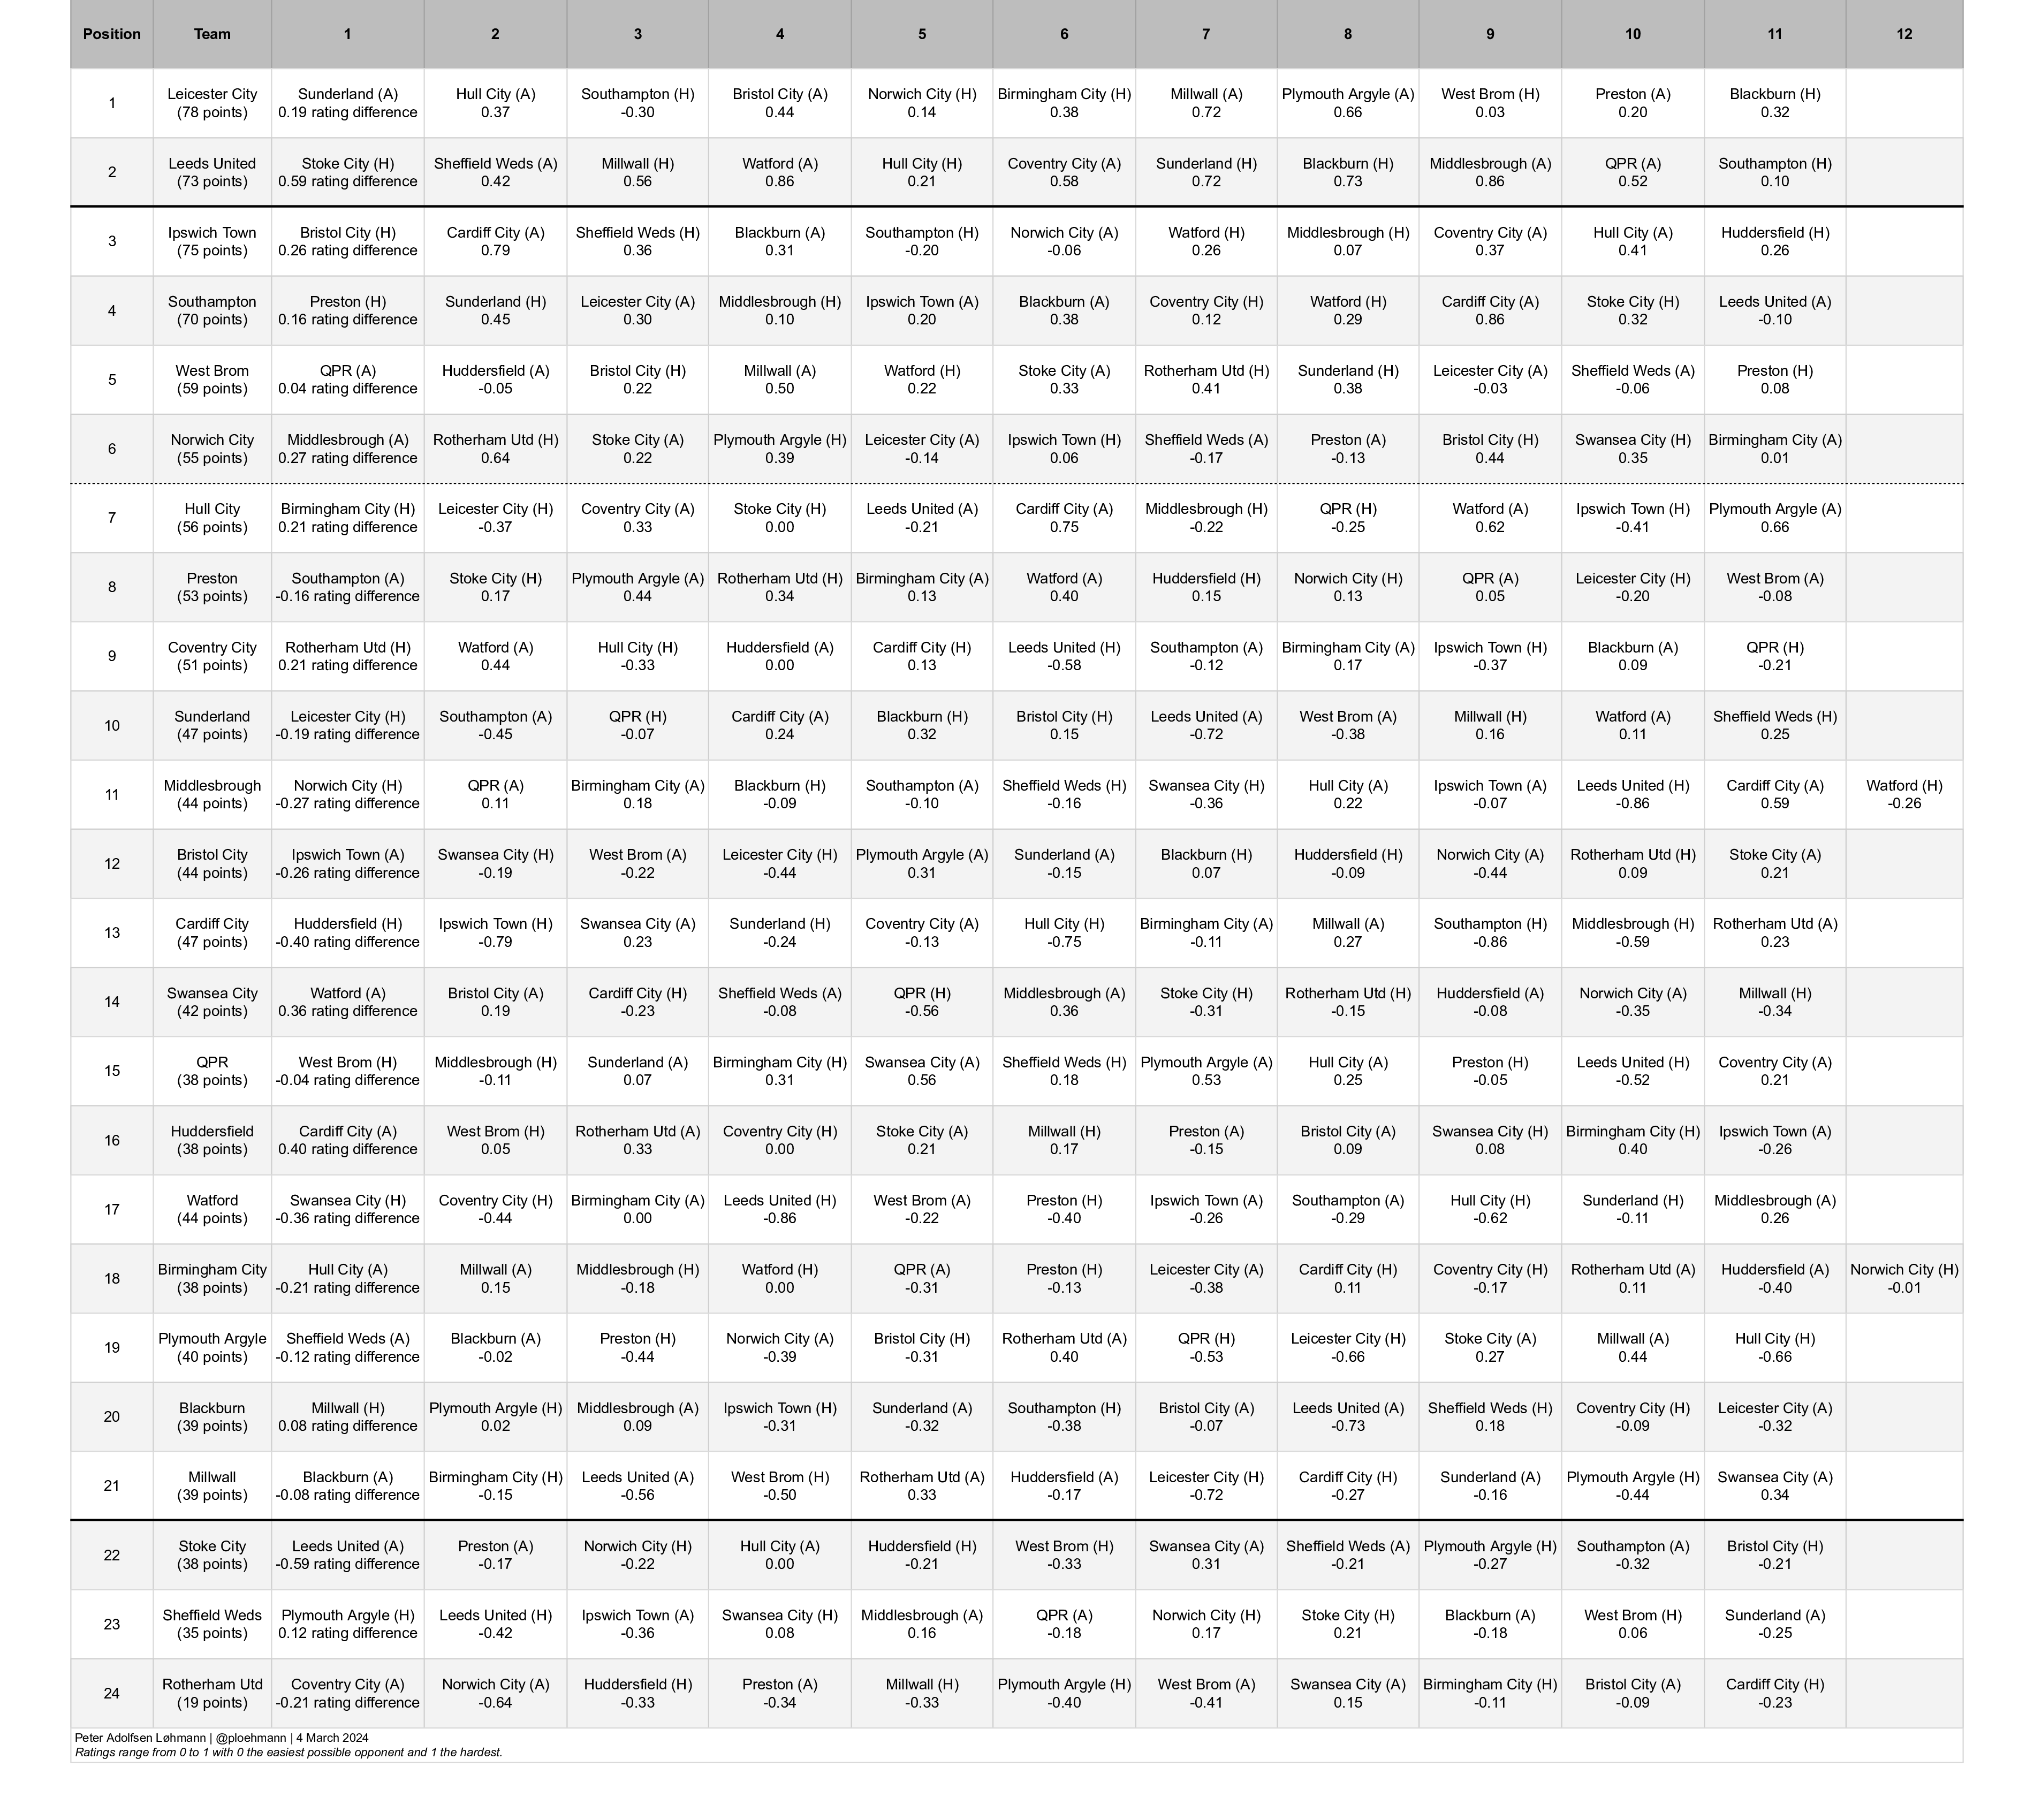
So, in a hypothetical world, if the team with the best form rating - Leeds United away - play the team with the worst form rating - Cardiff City at home - Leeds would get 3 points and Cardiff 0.
Another example: Wednesday would have 0.58 home rating for the visit of Plymouth Argyle’s 0.46 away rating, meaning +0.12 for Wednesday and -0.12 for Plymouth, which would give Wednesday 1.68 points and Plymouth 1.32 points from the game for the purposes of this ‘prediction model’.
We can then tally up all these predicted points from a team’s remaining games and add it together with their current points total to get a predicted final points tally. The final table would then look like this:
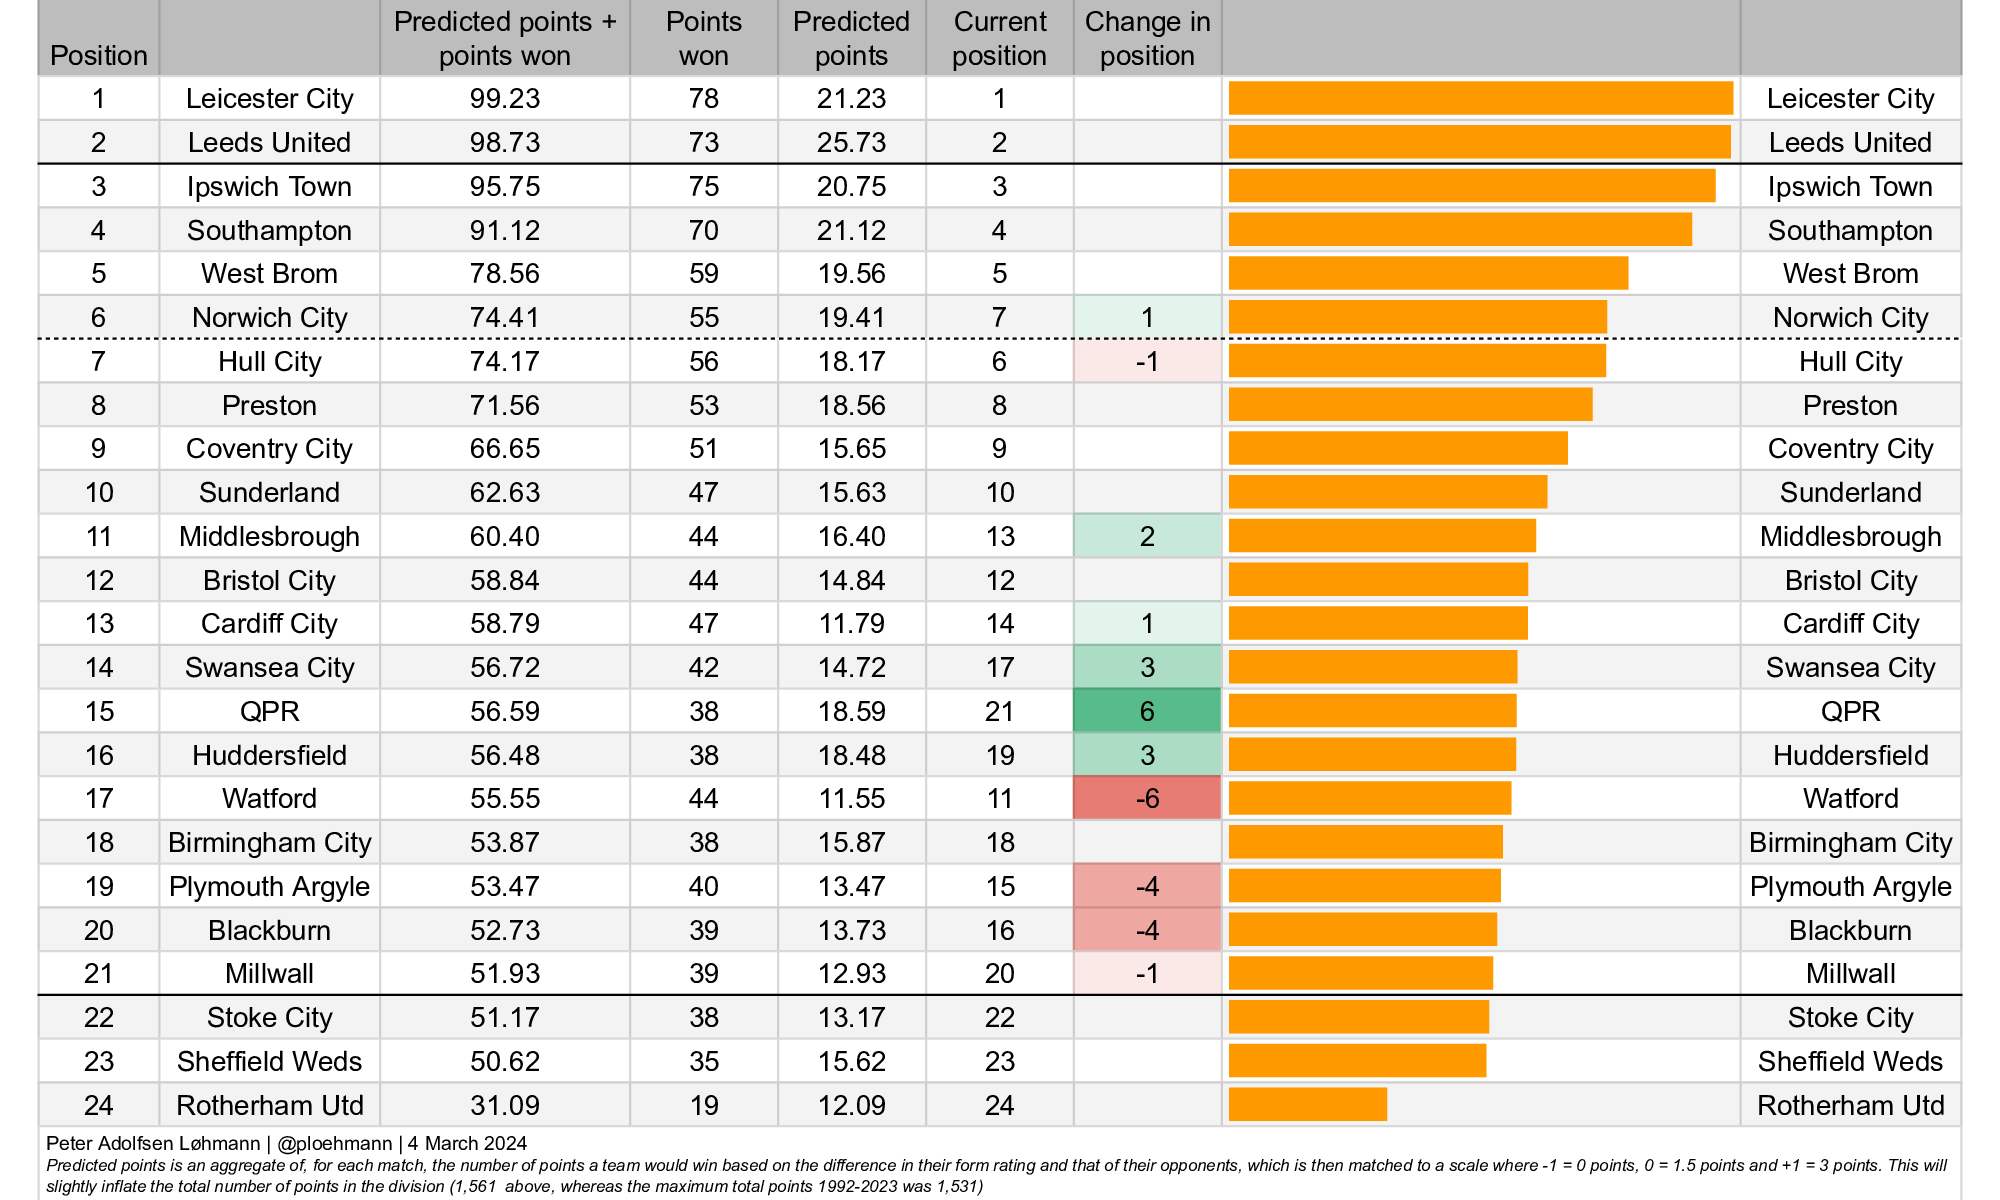
That’s…tight! This gives you the full whack of teams in the bottom six currently having good form recently just as it takes into account the teams that are left to play.
For fans like us of Sheffield Wednesday it rarely take much prompting to make us throw our hands to our head and go into full blown ‘oh my god, we’re all going to die!’ mode and seeing us still lodged in 23rd despite a predicted points haul of 15-16 points will deflate many.
My take is different:
Focus on the points we win, not a gap to or what other teams do
Danny Röhl said ‘I think it could be 50 this season’ on the points needed to stay up.’ In this simple prediction scenario, factoring in the recent form of the teams we have yet to play, we do reach that target of 50 points.
Bunched table gives ‘hunters’ more ‘prey’ than ever before
The gap from 23rd to 12th is 9 points and, on X, I’ve called it the most bunched at the bottom it’s ever been . That 9 points gap has quite literally never been lower after 35 matches (since 1992) than it is this season, so it’s fair to say that there’s a record number of teams who could still be concerned with relegation at this point:
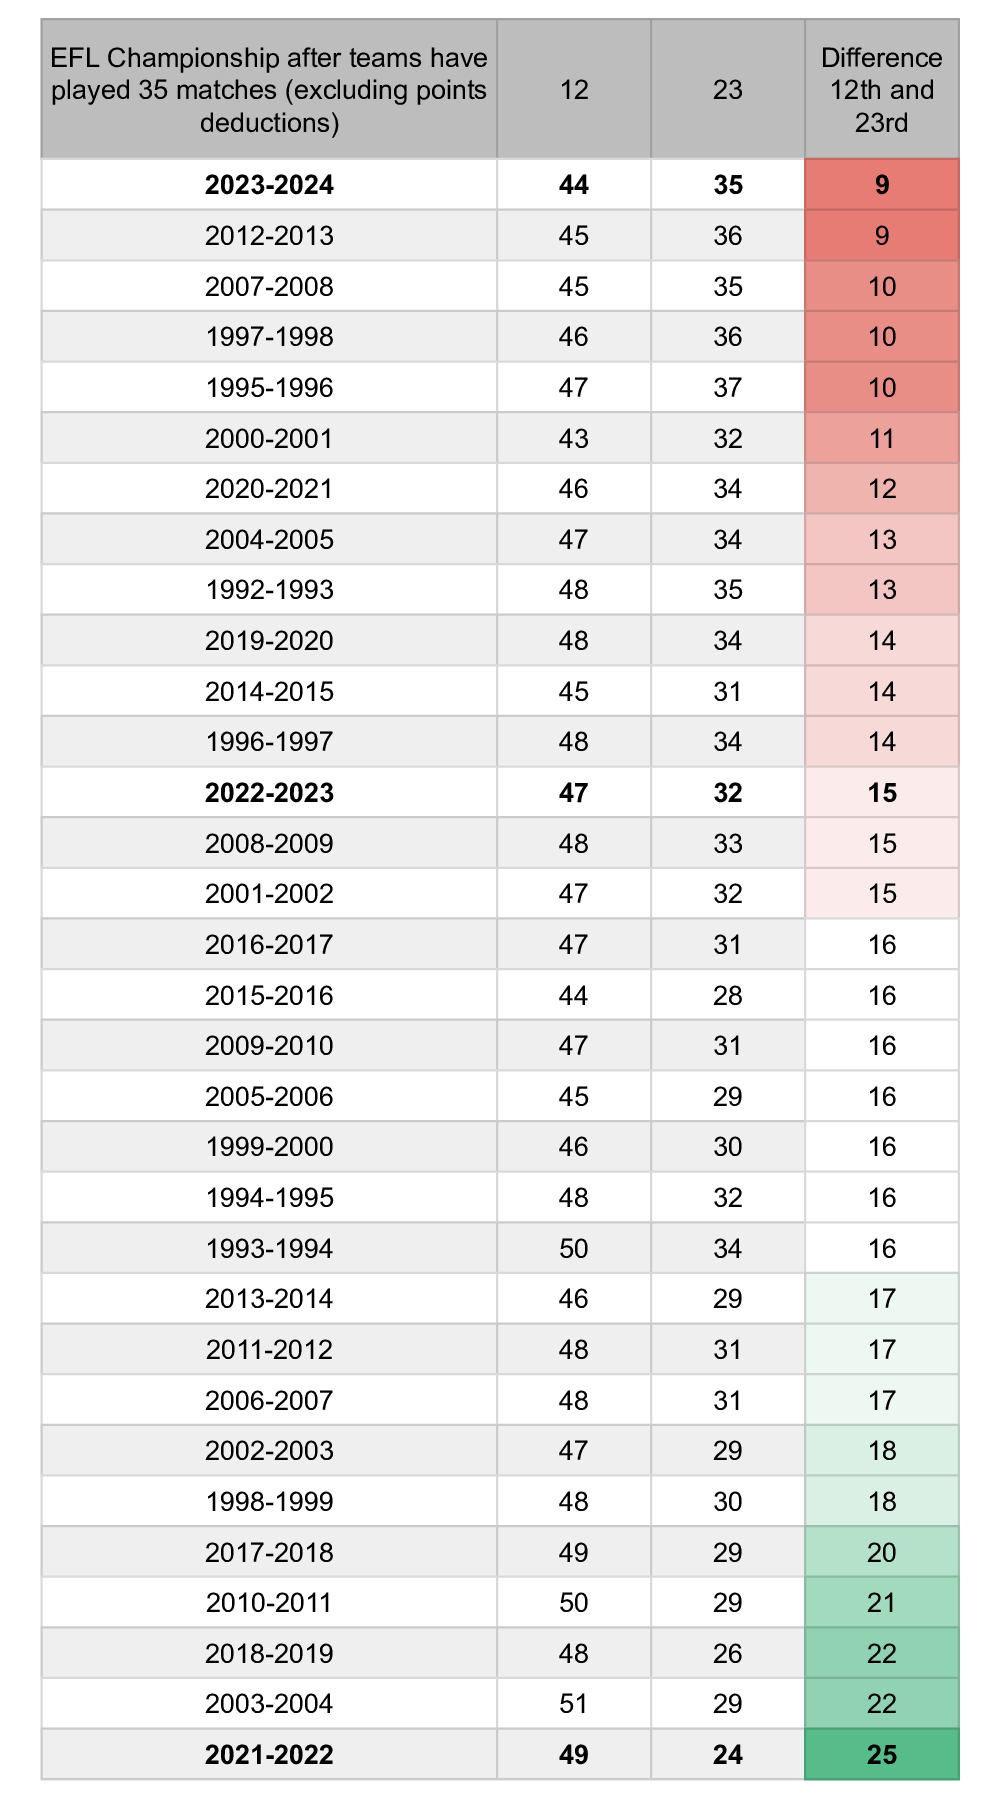
For comparison last season the gap was 15 points and the year before, in 2021-22, a record 25. This is a Championship season with a different dynamic than most. Survival doesn’t mean overtaking 10 teams. We ‘just’ have to put two of that group of 10 below ourselves come the end of play in May.
If we had to rely on 2 out of 4 teams stumbling and dropping their form the odds would be a lot lower than when we’re instead wanting to rely on 2 out of 10 teams doing so. Ideally that should temper our fears and embolden us. Something Danny Röhl has by declaring ‘we are the hunters, coming from behind to make pressure for the teams in front’.
Bottom third’s historical points haul
How do teams in the bottom six/bottom third of the table tend to do from here on in? We can get at that historically based on the number of points teams in particular positions in the table after 35 matches picked up in the final 11 matches:
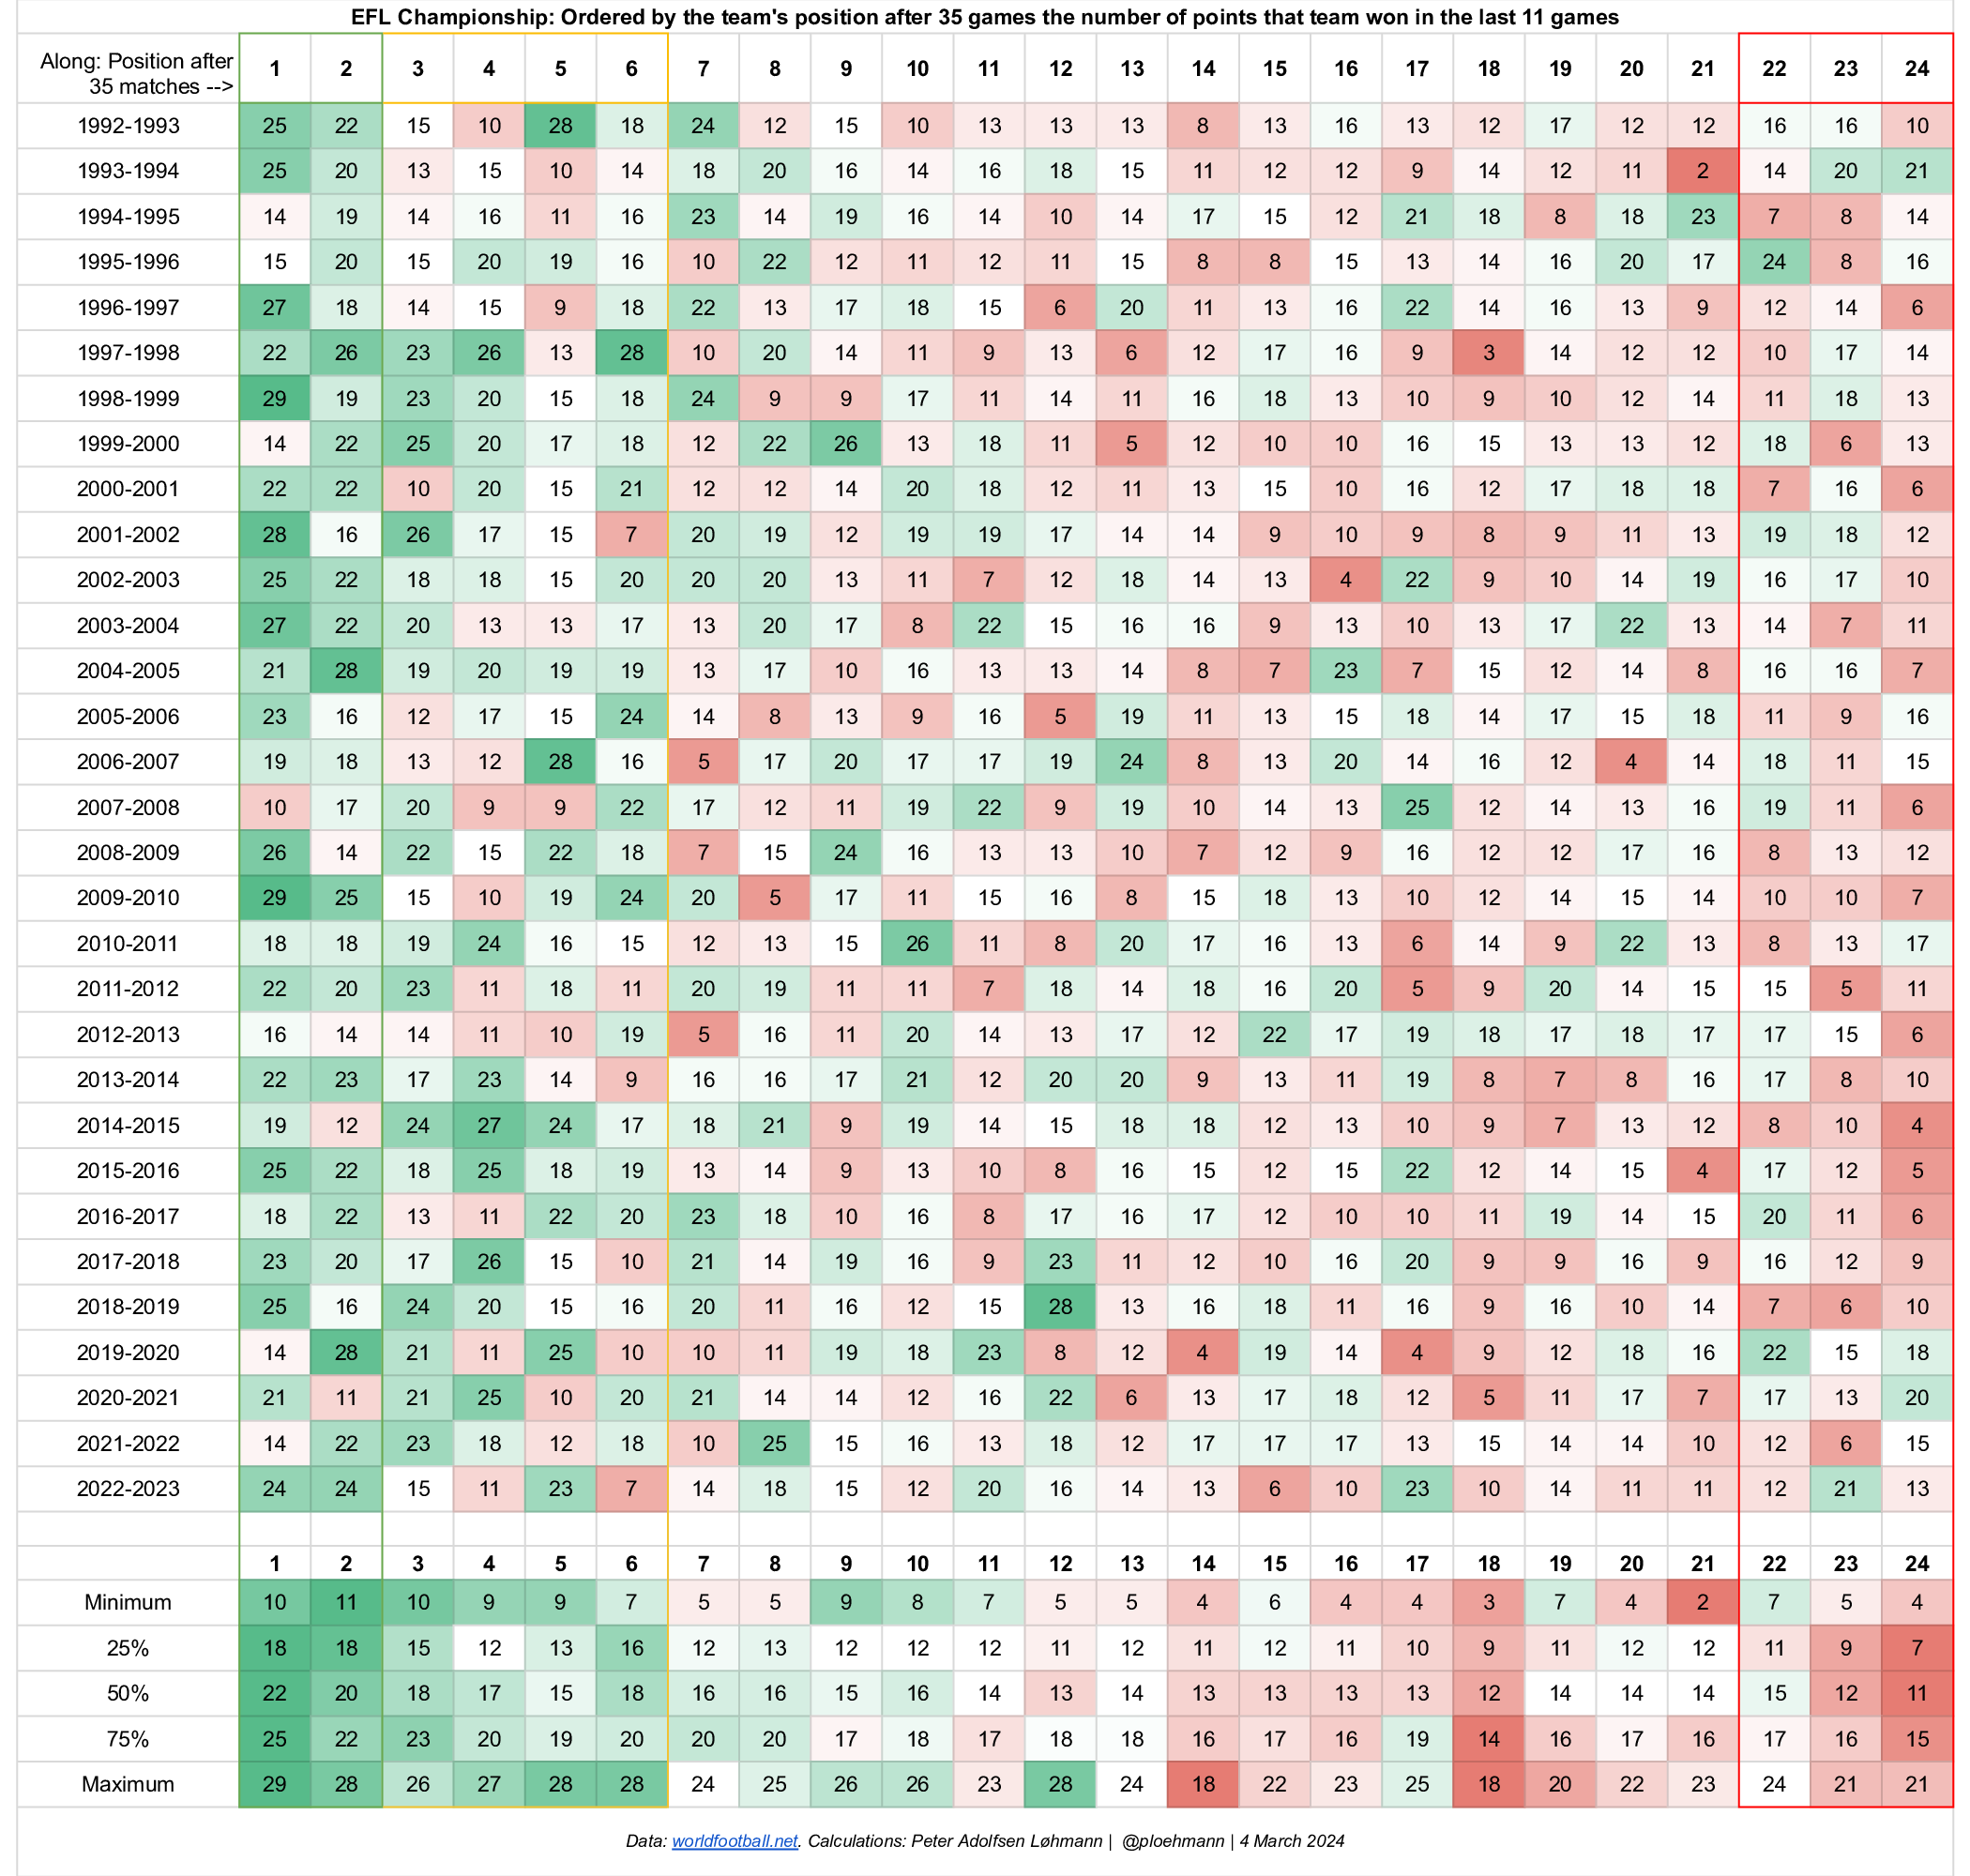
It obviously varies, but in 1 out of every 4 seasons teams in 16th-22nd win fewer than 10-11 points in the last 11 matches - and, at the other end, 1 out of every 4 seasons they win more than 14-17 points - and typically (the median) between 12 and 14 points.
My simple ‘model’ predicts a minimum of 13 points and up to 18 points for the teams currently in 16th to 23rd position. That would, historically, be on the high side indeed. Could it happen? Yes, but it’s probably more likely there’s at least a couple of those teams who are nearer the 10-11 points band than the 14-17 points band.
(Other) teams collapse (too)
As Wednesday fans we’re used to ‘typical Wednesday’ and ‘Wednesdaying it up’, a sort of (mostly) tongue-in-cheek morose expectation of Murphy’s Law always being in play against us.
The truth is, probably, that most other fans, collectively, share a similar sort of dejected deterministic defeatism; other teams collapse too!
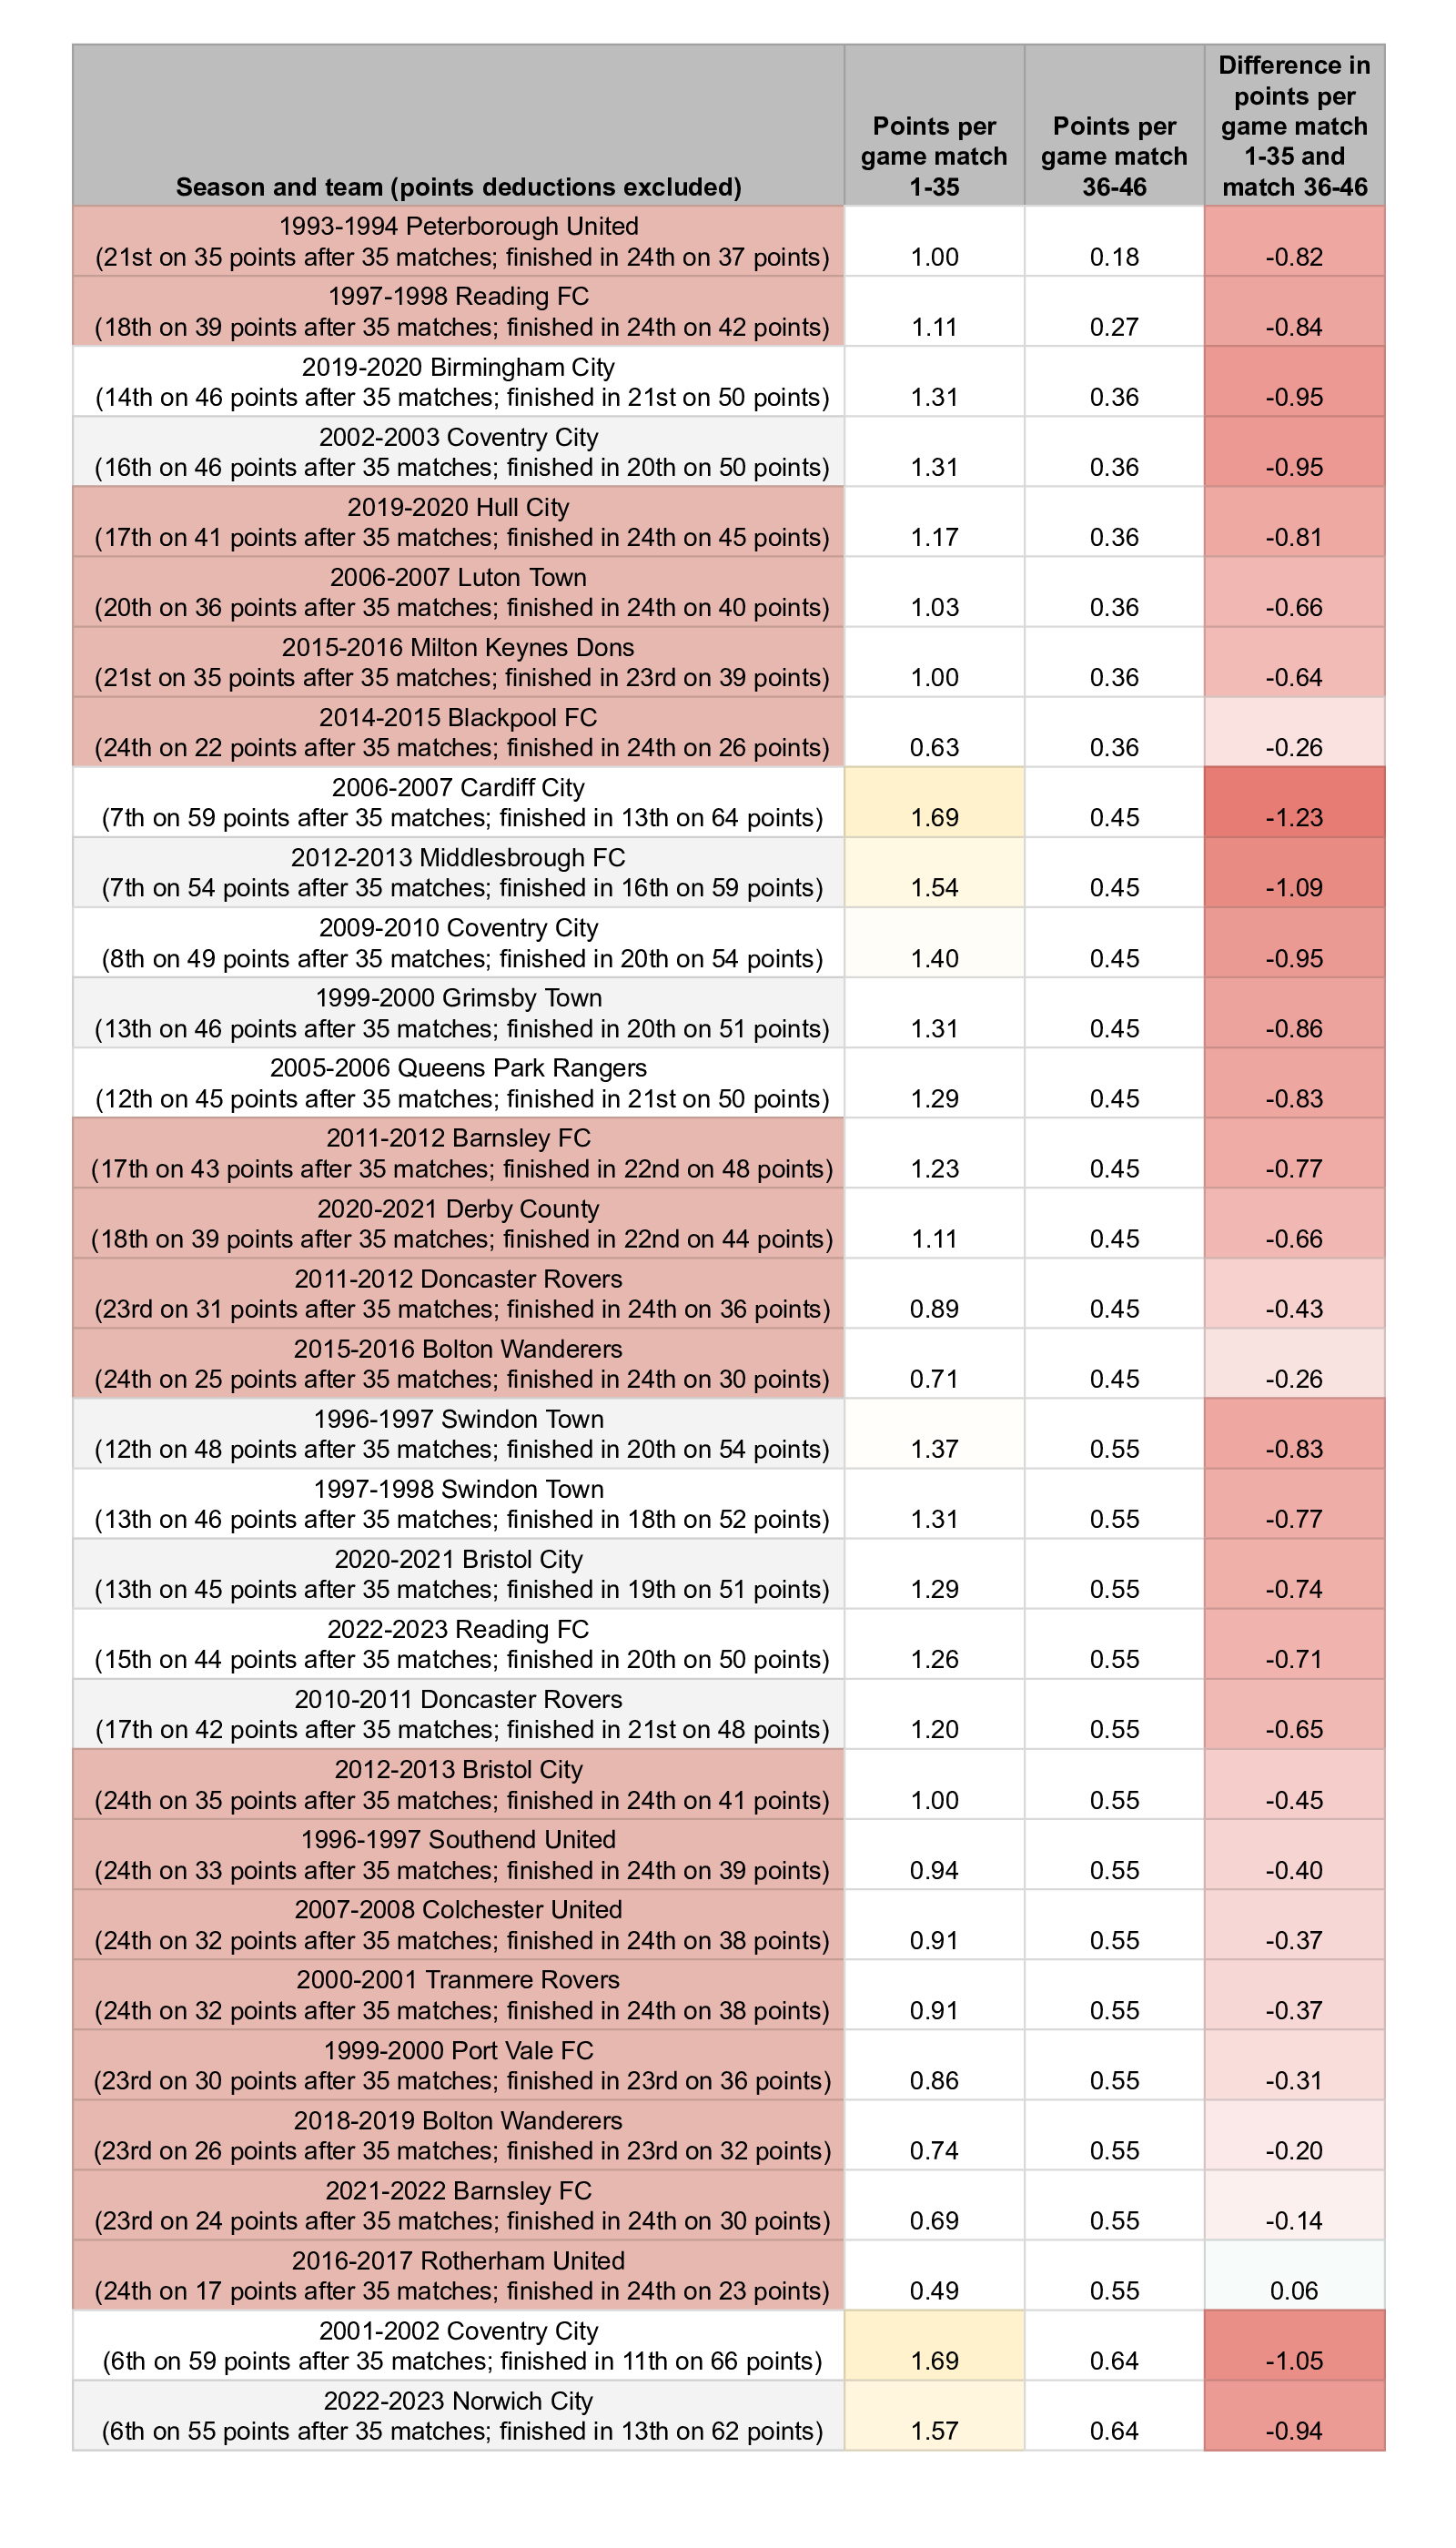
It may be worthwhile, then, to look at the teams with the worst points per game record in the last 11 games.
148 (!) Championship team that won fewer than 11 points in the final 11 matches of their seasons and plenty found themselves plunged into relegation in the process. Here’s the 32 worst of them, but here’s the full list:
Teams do get out of this mess
If we glance at how the positions in the table changed from now - 35 matches in - and until the end of the season, we see that while quite bloody and red in that bottom three, there are also plenty of ‘escapists’ in there too as well as at least roughly a team a season that falls from 20th upwards and into the bottom three at season’s end:
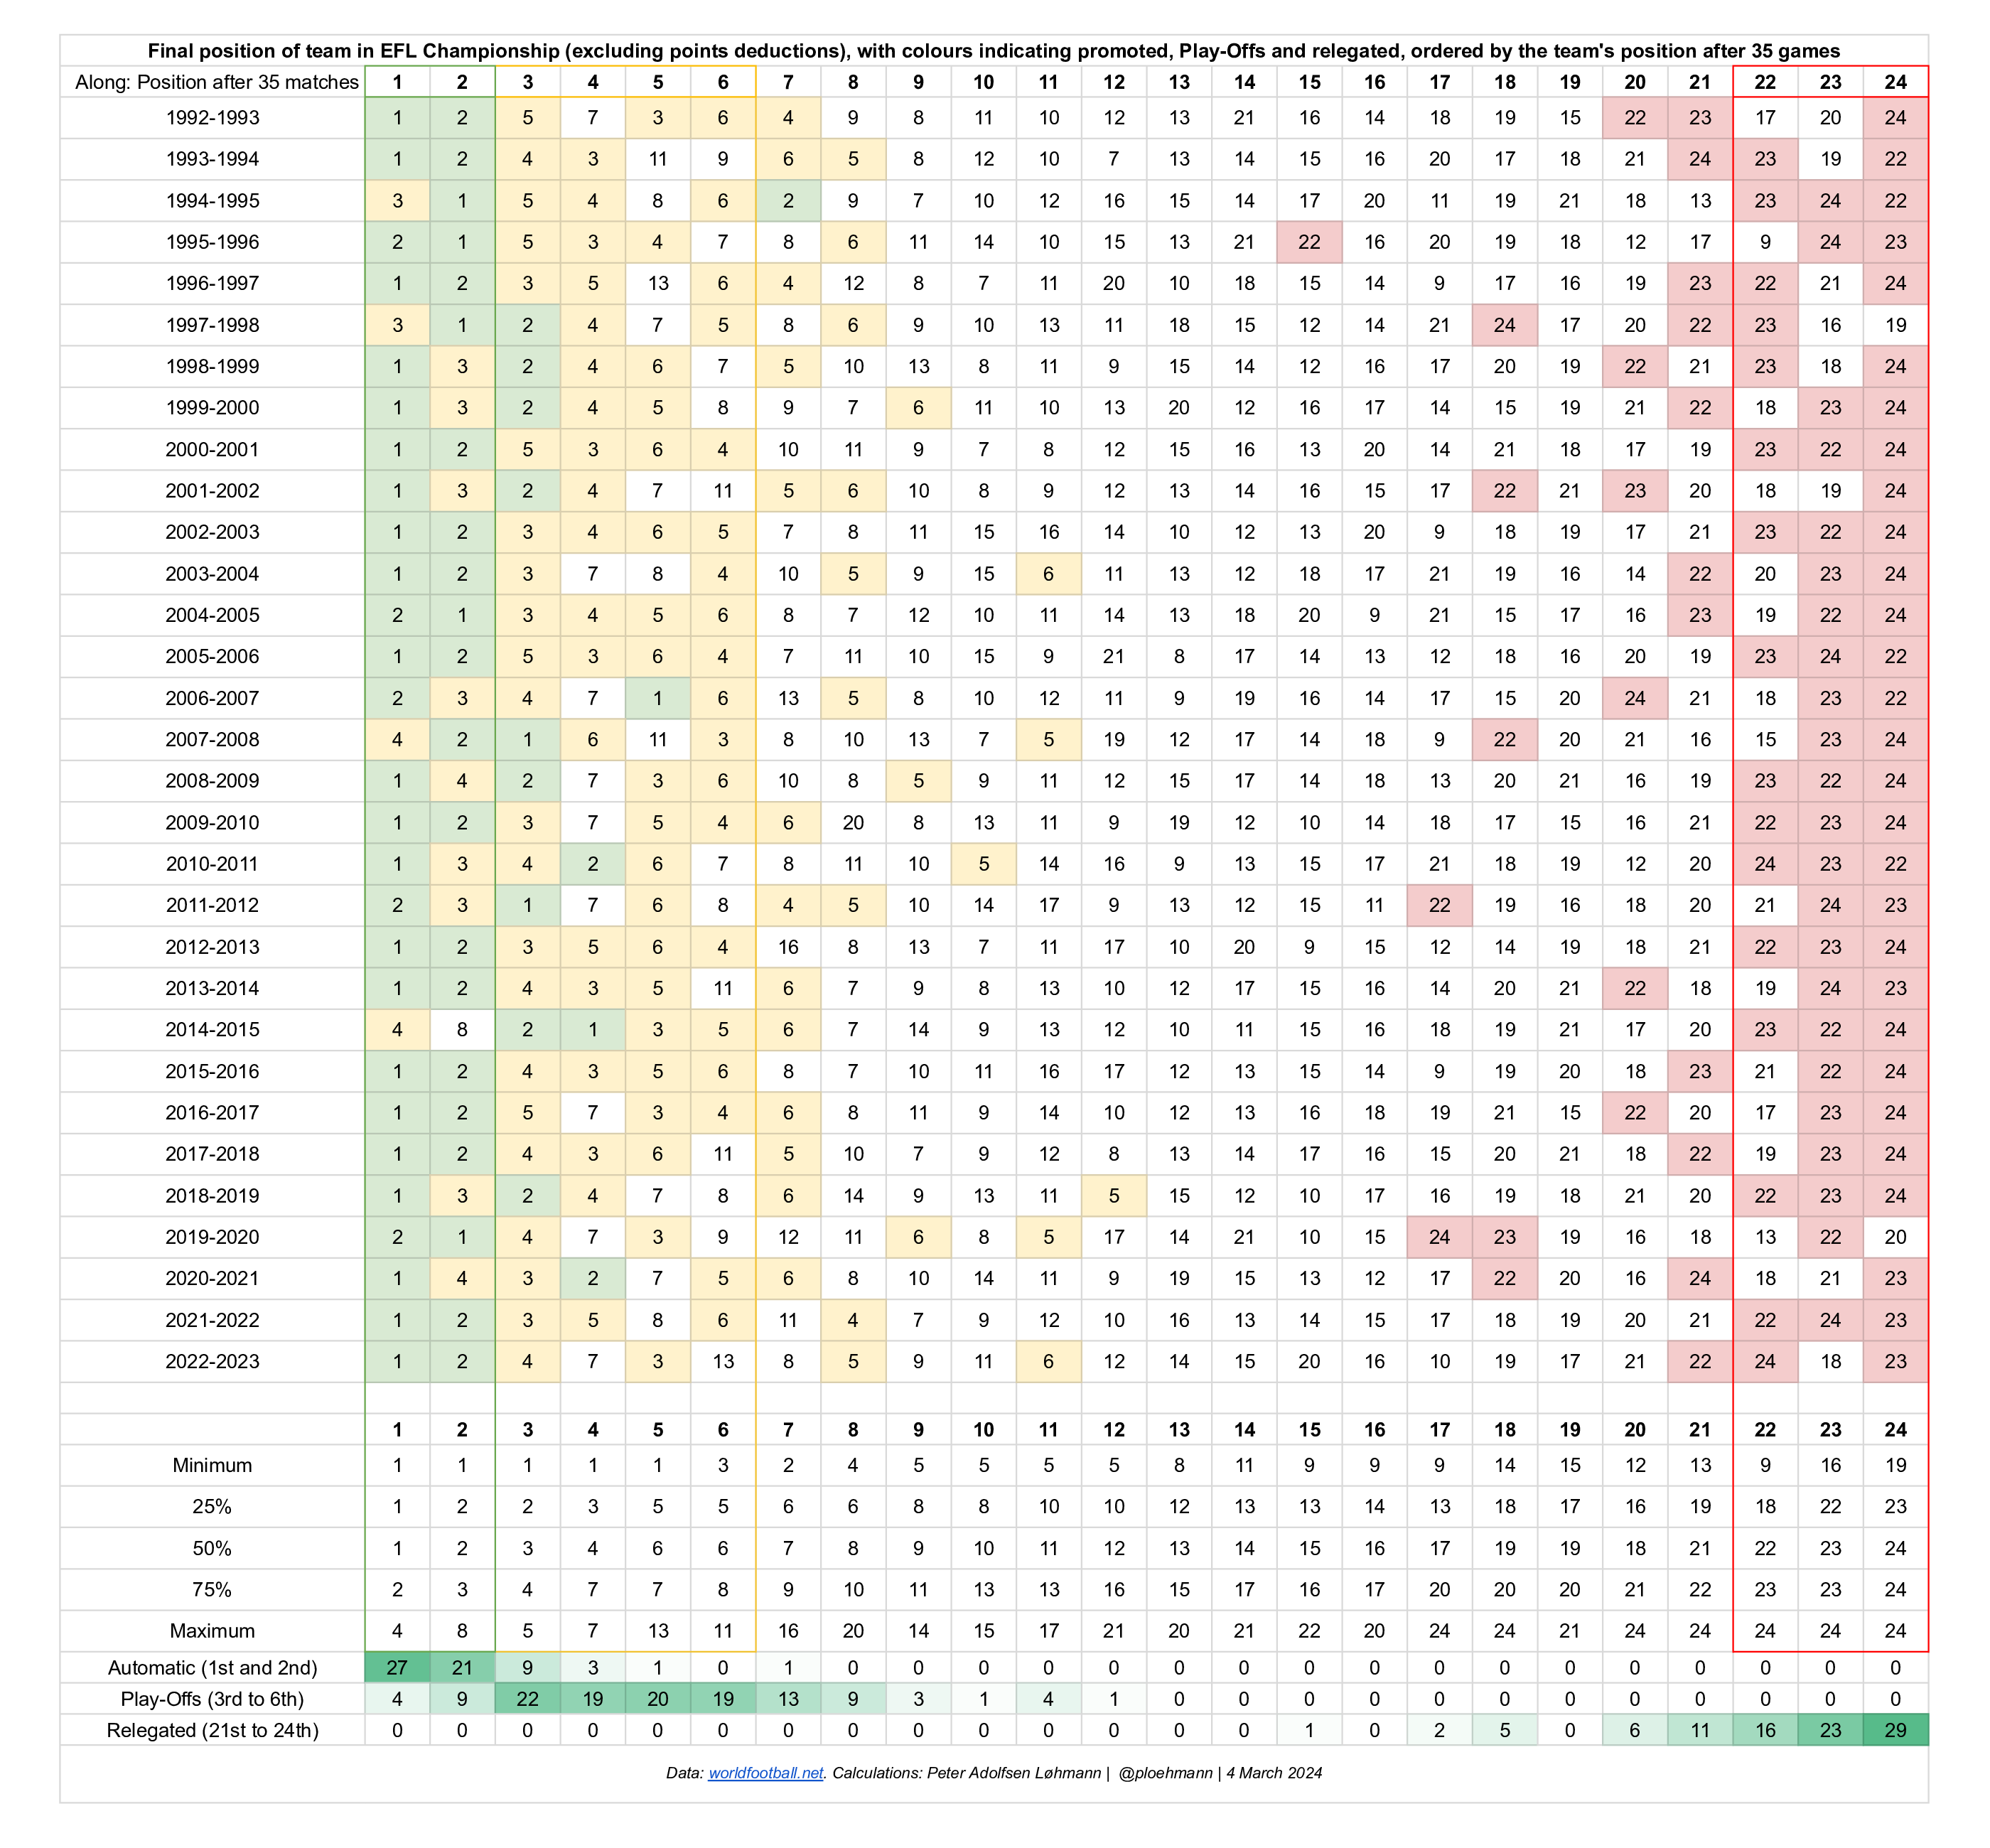
Though it might be a random quirk, the team in 23rd have also survived in two of the last three seasons.
And, finally, speaking of random quirks…
*Wednesday* get out of this mess
While rummaging I found something astounding (as posted on X):
We have the EXACT SAME points won, wins, draws, losses, matches played and goal difference as we did exactly 23 years ago to the day (5 March):


Yes, an obvious difference being we were three points above the drop zone, not three points deep in it. But another quirk of startling similarity between the seasons is interesting: Back in 2001 we had also just won three of the last four as we have now.
That set us up for a flying finish to the 2000-2001 season, winning 18 points in those final 11 matches and finishing five points clear of relegation, beating 5th, 6th and 7th, drawing 1st away and losing to 15th, 19th and the Blades:


So there you have it, how the Hunger Games of the EFL Championship’s 2024 relegation battle could finish!
Here are the fixture lists of every team, ordered by league position, and with venue and the difference in the team’s and the opponent’s form rating listed:
In technical terms they simulate the remaining matches in the Championship 10,000 times using team rankings (Opta Power Ranking) that are based on teams’ (recent) performances and see what percentage of those 10,000 times a team finishes in each position. Wednesday finish 23rd 39% of times, 22nd 20% of times meaning we finish 21st or better 41% of times.
Through the over 200,000 league matches played since the Football League was founded in 1888 51% have been home wins, 25% draws and 24% away wins. Since the split of the Premier League in 1992 the figures are 44%, 27% and 29%.